R package pliman
 Image by Tiago Olivoto
pliman (plant image analysis) is designed to analyze plant images, especially related to leaf analysis. You provide color palettes, tell pliman what each one represents, and it takes care of the details. Image indexes can also be used to segment images. The package will help you to:
- Measure leaf area with
leaf_area() - Measure disease severity with
symptomatic_area() - Count the number of lesions with
count_lesions() - Count objects in an image with
count_objects() - Get the RGB values for each object in an image with
objects_rgb() - Get object measures with
get_measures() - Plot object measures with
plot_measures()
pliman also provides useful functions for
operation,
transformation, and
segmentation of images. Please, visit the
Examples page in pliman website for a detailed documentation of each function.
Installation
Install the latest stable version of pliman from
CRAN with:
install.packages("pliman")
The development version of pliman can be installed from
GitHub with:
devtools::install_github("TiagoOlivoto/pliman")

# To build the HTML vignette use
devtools::install_github("TiagoOlivoto/pliman", build_vignettes = TRUE)
Note: If you are a Windows user, you should also first download and install the latest version of Rtools.
Basic usage
Disease severity
library(pliman)
## |========================================================|
## | Tools for Plant Image Analysis (pliman 0.2.0) |
## | Author: Tiago Olivoto |
## | Type 'vignette('pliman_start')' for a short tutorial |
## | Visit 'https://bit.ly/3eL0dF3' for a complete tutorial |
## |========================================================|
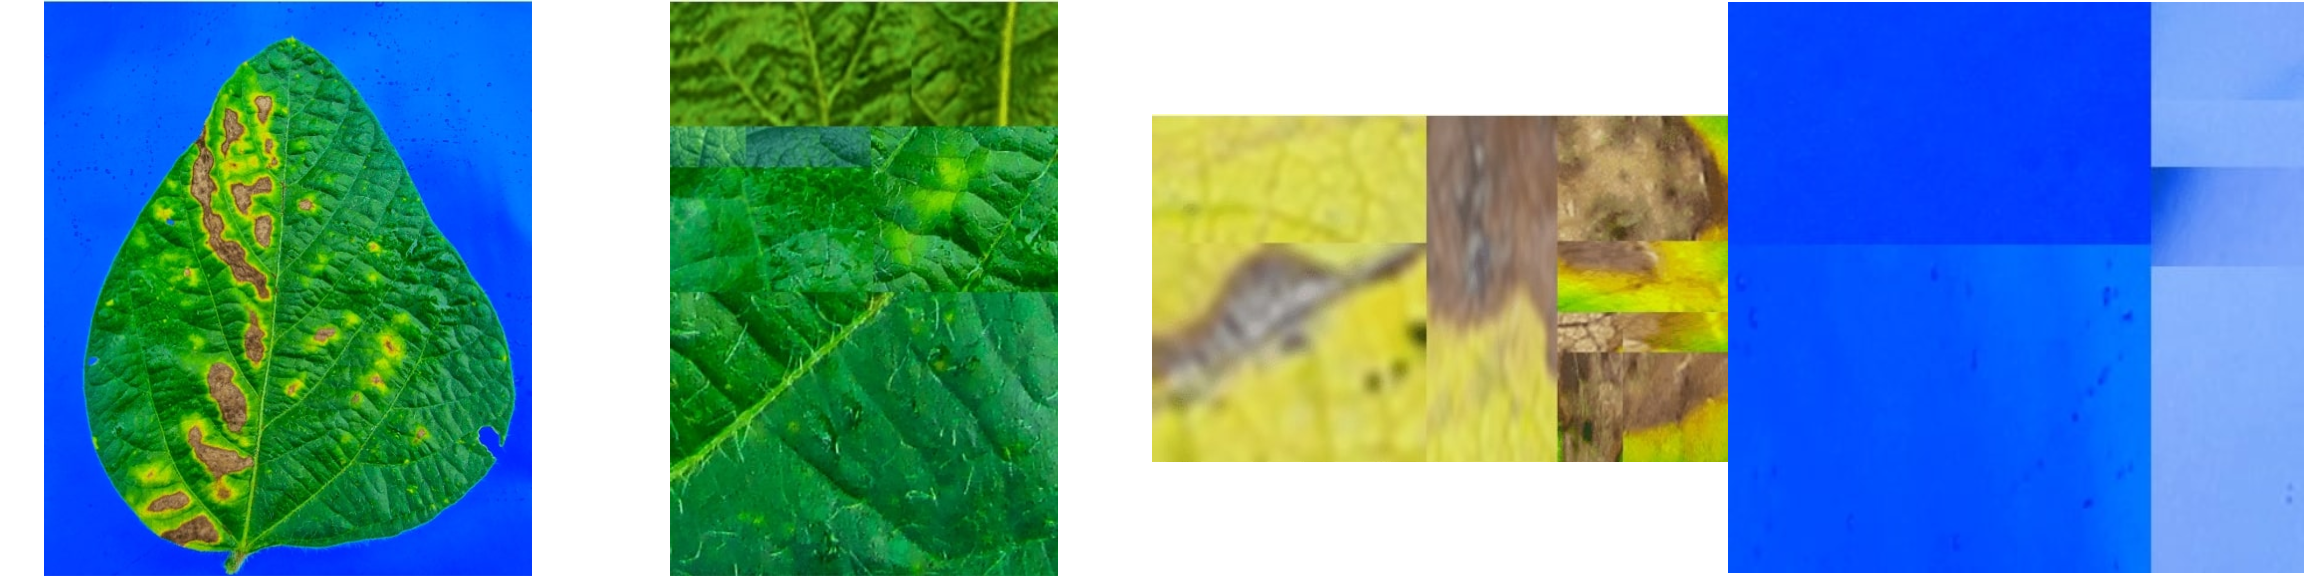
img <- image_import(image_pliman("sev_leaf.jpg"))
healthy <- image_import(image_pliman("sev_healthy.jpg"))
symptoms <- image_import(image_pliman("sev_sympt.jpg"))
background <- image_import(image_pliman("sev_back.jpg"))
image_combine(img, healthy, symptoms, background, ncol = 4)
symptomatic_area(img = img,
                 img_healthy = healthy,
                 img_symptoms = symptoms,
                 img_background = background,
                 show_image = TRUE)
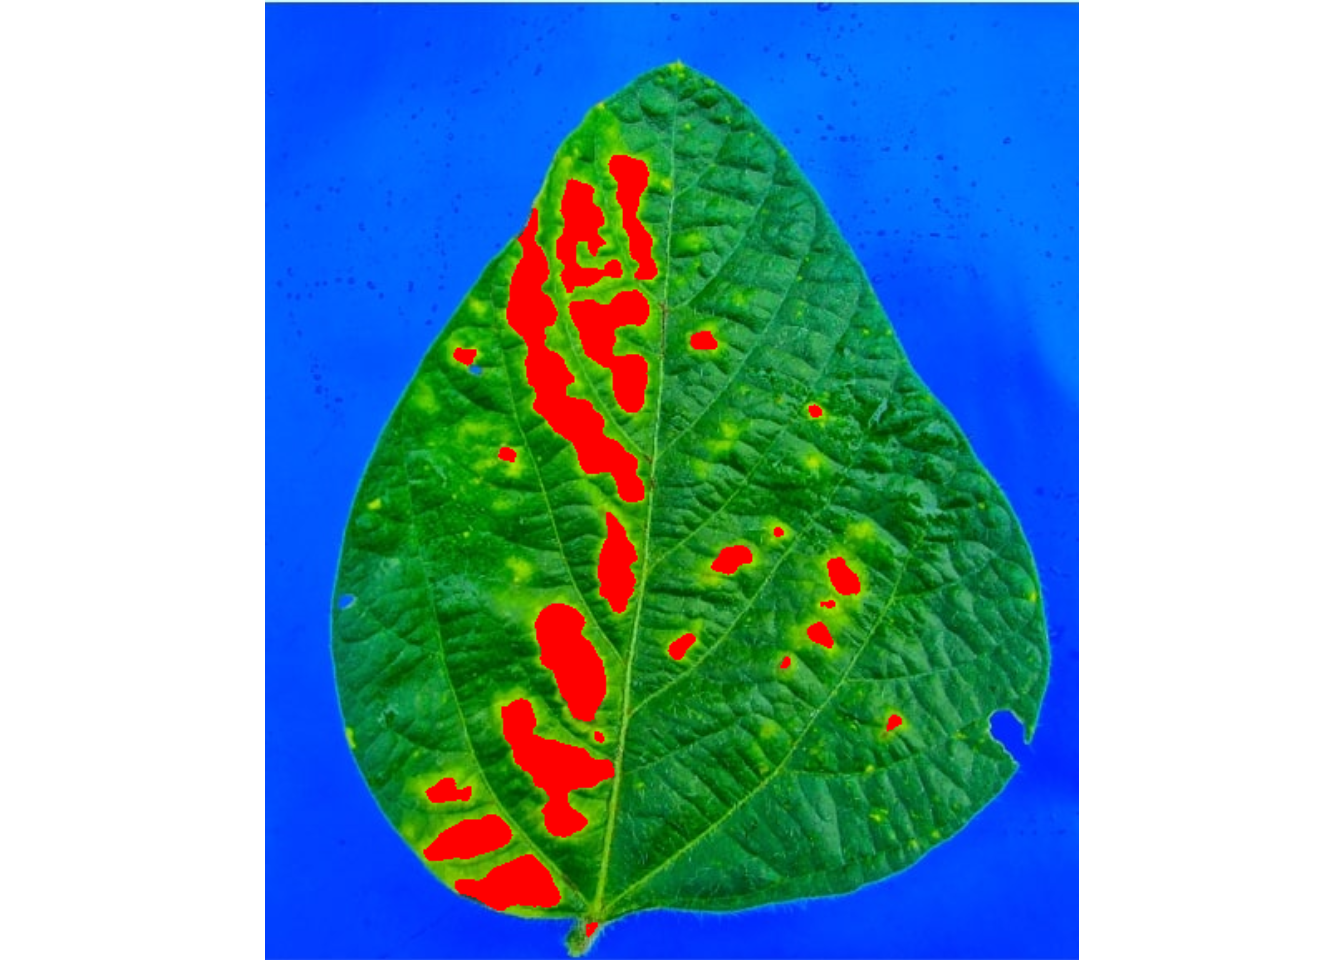
##    healthy symptomatic
## 1 88.91402    11.08598
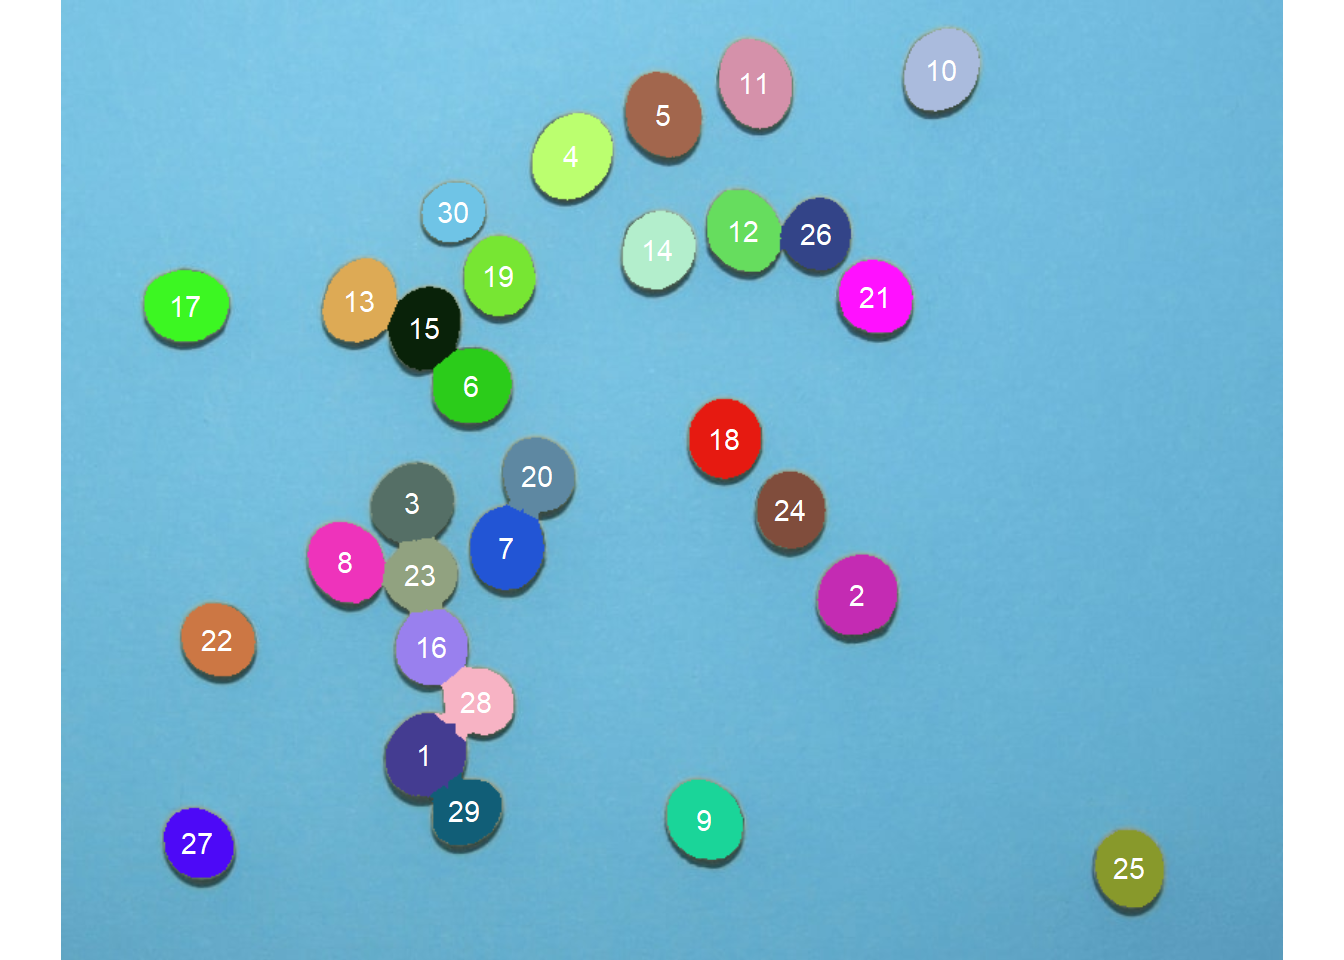
Count objects
The function count_objects() can be used to count the objects such as leaves, grains, pods, pollen in an image. In the following example, we will count the number of soybean grains of an image with 30 grains.
img <- image_import(image_pliman("soybean_touch.jpg"))
image_show(img)
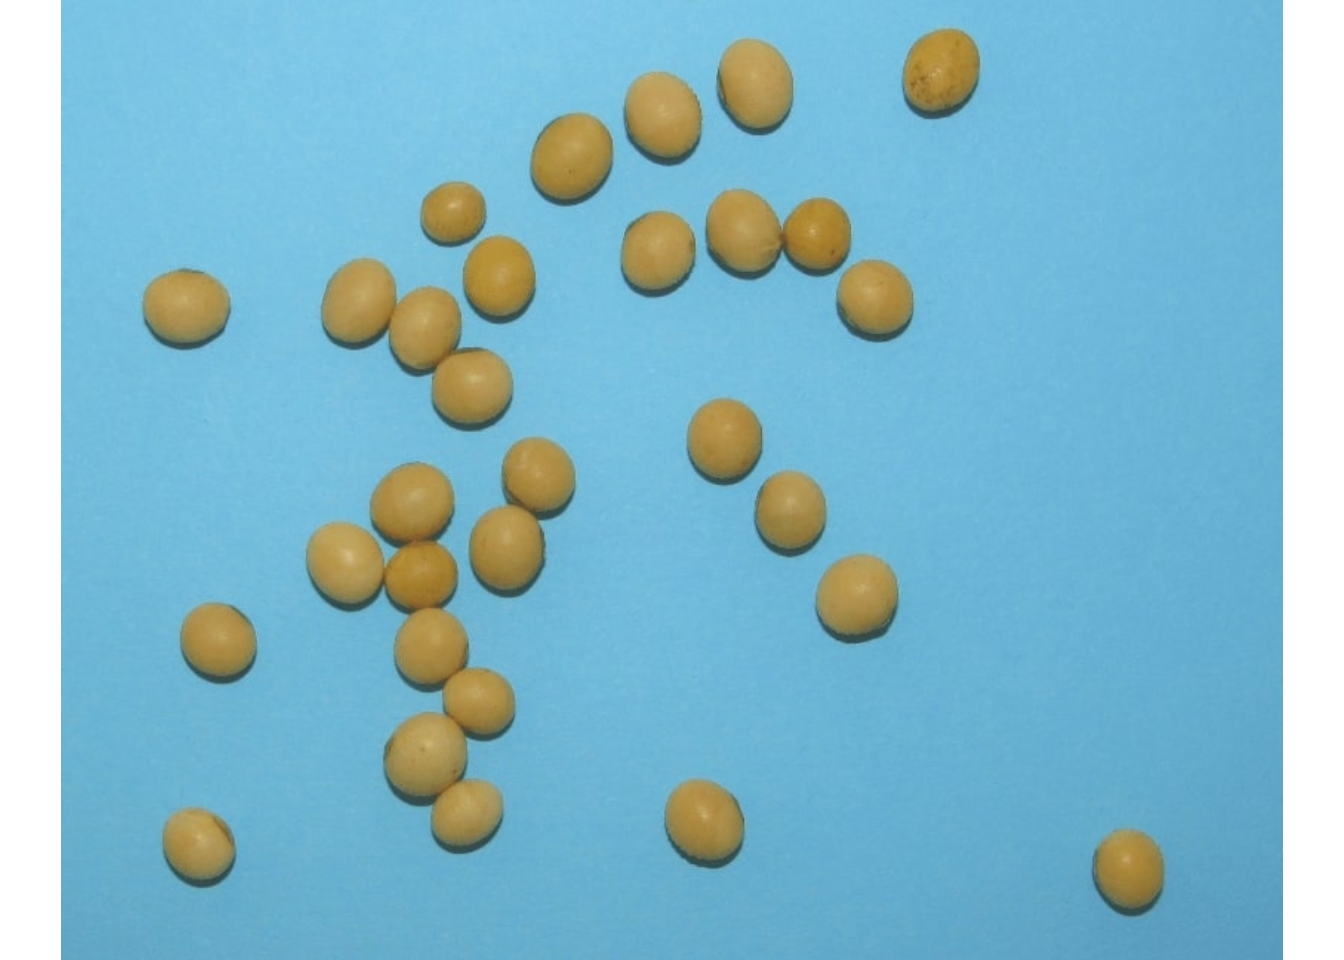
count_objects(img, marker = "text")
##
## --------------------------------------------
## Number of objects: 30
## --------------------------------------------
##  statistics       area   perimeter
##         min  1366.0000  117.000000
##        mean  2057.3667  146.600000
##         max  2445.0000  158.000000
##          sd   230.5574    8.406073
##         sum 61721.0000 4398.000000
pliman takes the advantage of several powerful functions from
EBImage package. Thanks to Andrzej Oleś and collaborators for the impressive job done with EBImage!
Getting help
-
If you encounter a clear bug, please file a minimal reproducible example on github
-
Suggestions and criticisms to improve the quality and usability of the package are welcome!
Code of Conduct
Please note that the pliman project is released with a Contributor Code of Conduct. By contributing to this project, you agree to abide by its terms.