metan v1.5.1 on CRAN
Overview
The version v1.5.1 of the R package metan in now on
CRAN. This is a patch release that fixes a bug with the example of the function
plot.fai_blup(). Minor improvements were made in the functions
plot_bars() and
plot_factbars()
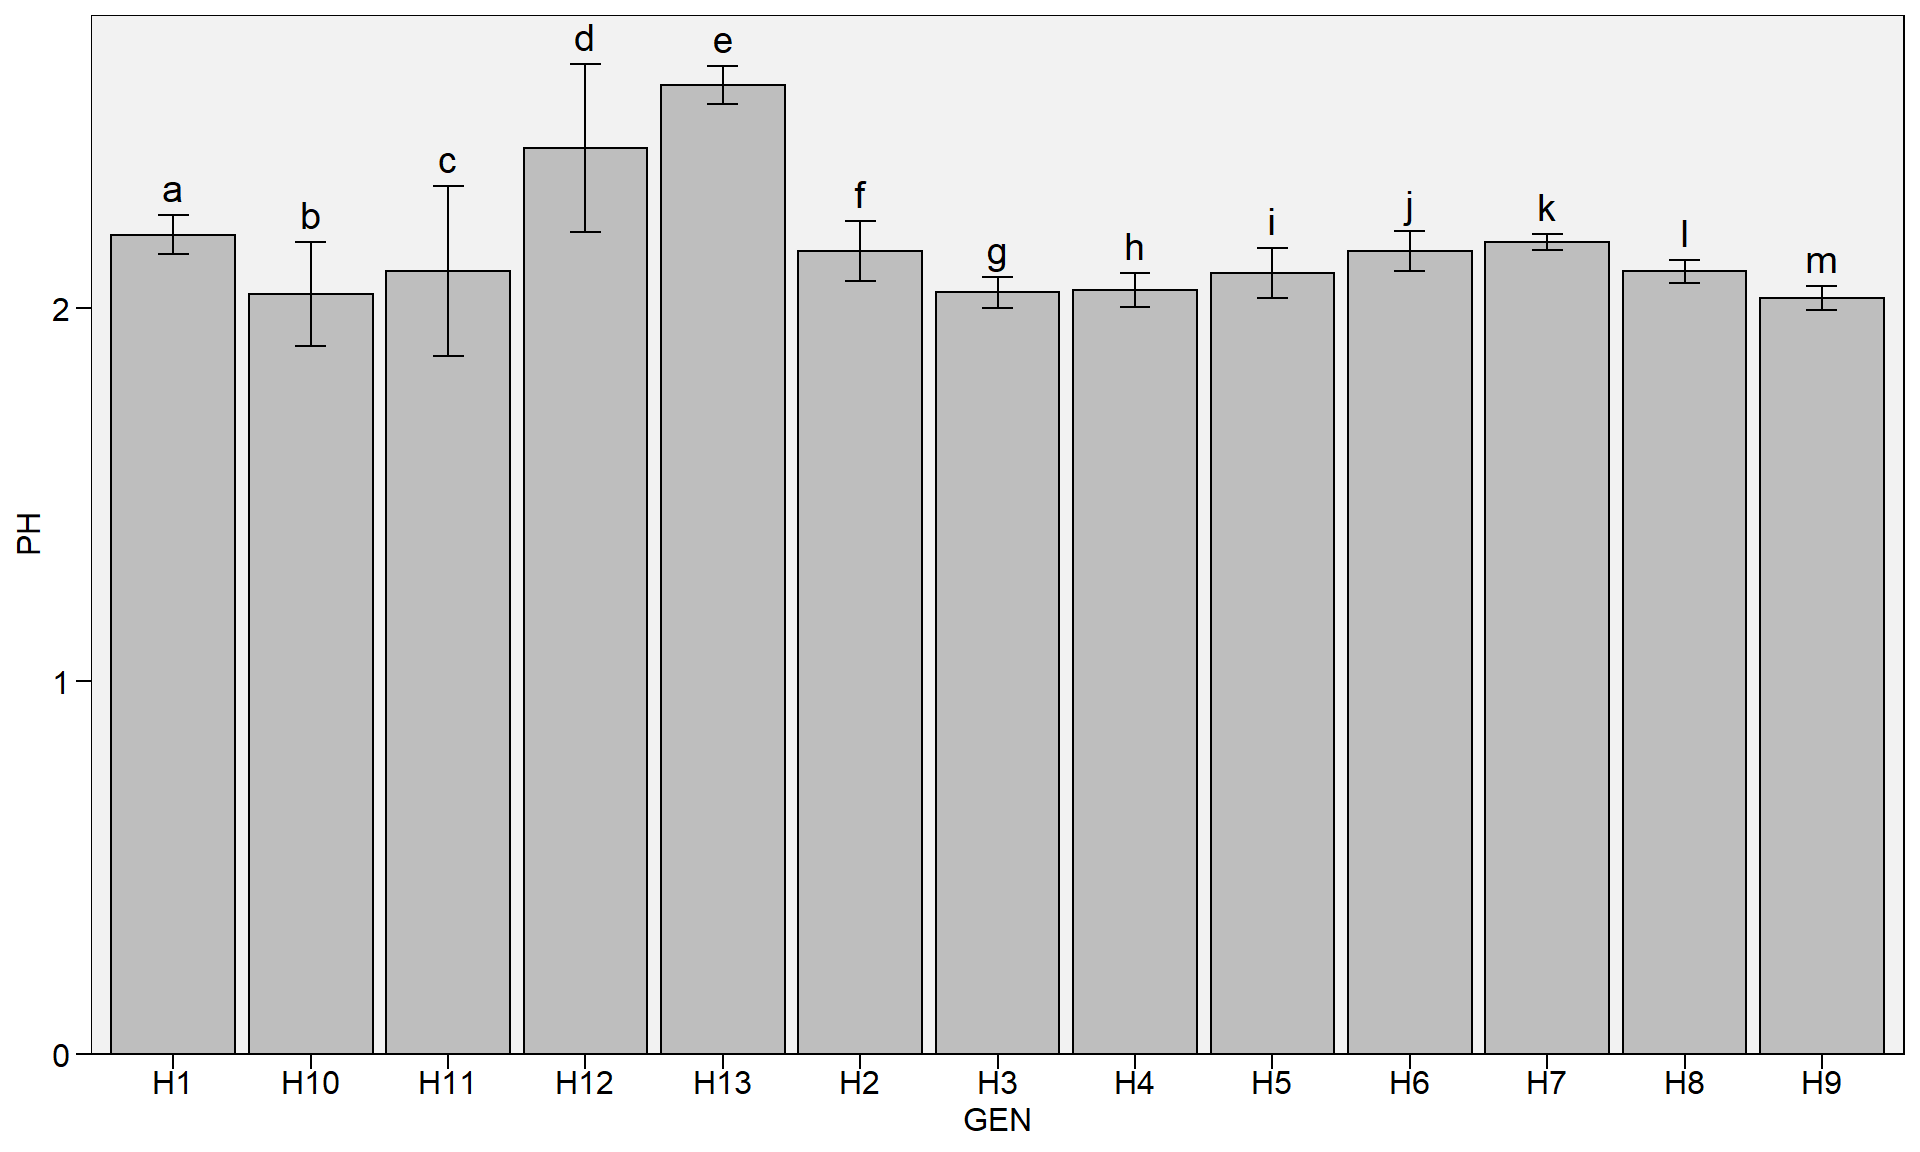
Barplots
plot_bars() and
plot_factbars() now align vertically the labels to the error bars (when present) instead the plot bar.
library(metan)
plot_bars(data_g, GEN, PH, lab.bar = letters[1:13])
fai_blup()
fai_blup()now returns the eigenvalues and explained variance for each axis and variables into columns instead row names.
mod <- waasb(data_ge,
             env = ENV,
             gen = GEN,
             rep = REP,
             resp = c(GY, HM))
## Evaluating trait GY |======================                      | 50% 00:00:00
Evaluating trait HM |============================================| 100% 00:00:01
## Method: REML/BLUP
## Random effects: GEN, GEN:ENV
## Fixed effects: ENV, REP(ENV)
## Denominador DF: Satterthwaite's method
## ---------------------------------------------------------------------------
## P-values for Likelihood Ratio Test of the analyzed traits
## ---------------------------------------------------------------------------
##     model       GY       HM
##  COMPLETE       NA       NA
##       GEN 1.11e-05 5.07e-03
##   GEN:ENV 2.15e-11 2.27e-15
## ---------------------------------------------------------------------------
## All variables with significant (p < 0.05) genotype-vs-environment interaction
FAI <- fai_blup(mod,
                SI = 15,
                DI = c('max, max'),
                UI = c('min, min'))
##
## -----------------------------------------------------------------------------------
## Principal Component Analysis
## -----------------------------------------------------------------------------------
##     eigen.values cumulative.var
## PC1          1.1          55.23
## PC2          0.9         100.00
##
## -----------------------------------------------------------------------------------
## Factor Analysis
## -----------------------------------------------------------------------------------
##      FA1 comunalits
## GY -0.74       0.55
## HM  0.74       0.55
##
## -----------------------------------------------------------------------------------
## Comunalit Mean: 0.5523038
## Selection differential
## -----------------------------------------------------------------------------------
##   VAR Factor        Xo        Xs          SD     SDperc    sense goal
## 1  GY      1  2.674242  2.594199 -0.08004274 -2.9931005 increase    0
## 2  HM      1 48.088286 48.005568 -0.08271774 -0.1720122 increase    0
##
## -----------------------------------------------------------------------------------
## Selected genotypes
## G4 G9
## -----------------------------------------------------------------------------------
print(FAI$eigen)
## # A tibble: 2 x 3
##   PC    eigen.values cumulative.var
##   <chr>        <dbl>          <dbl>
## 1 PC1          1.10            55.2
## 2 PC2          0.895          100
print(FAI$canonical.loadings)
## NULL
Find out more about metan at https://tiagoolivoto.github.io/metan/