Combining separate ggplots with metan
metan now uses
patchwork package syntax for composing plots, either internally as example of
residual_plots() or explicitly, with
arrange_ggplot(). This function is now a wrapper around patchwork’s functions
wrap_elements(),
plot_layout(), and
plot_annotation(). Many thanks to
Thomas Lin Pedersen for his impressive work with patchwork.
From now on it will be ridiculously simple to combine separate ggplots into the same graphic using operators (+) and (/) in metan. To access the news simply install the development version with
devtools::install_github("TiagoOlivoto/metan")
Some motivating examples
library(metan)
# Create a simple data
df <-
data_ge %>%
subset(GEN %in% c("G1", "G2", "G3") & ENV %in% c("E1", "E2"))
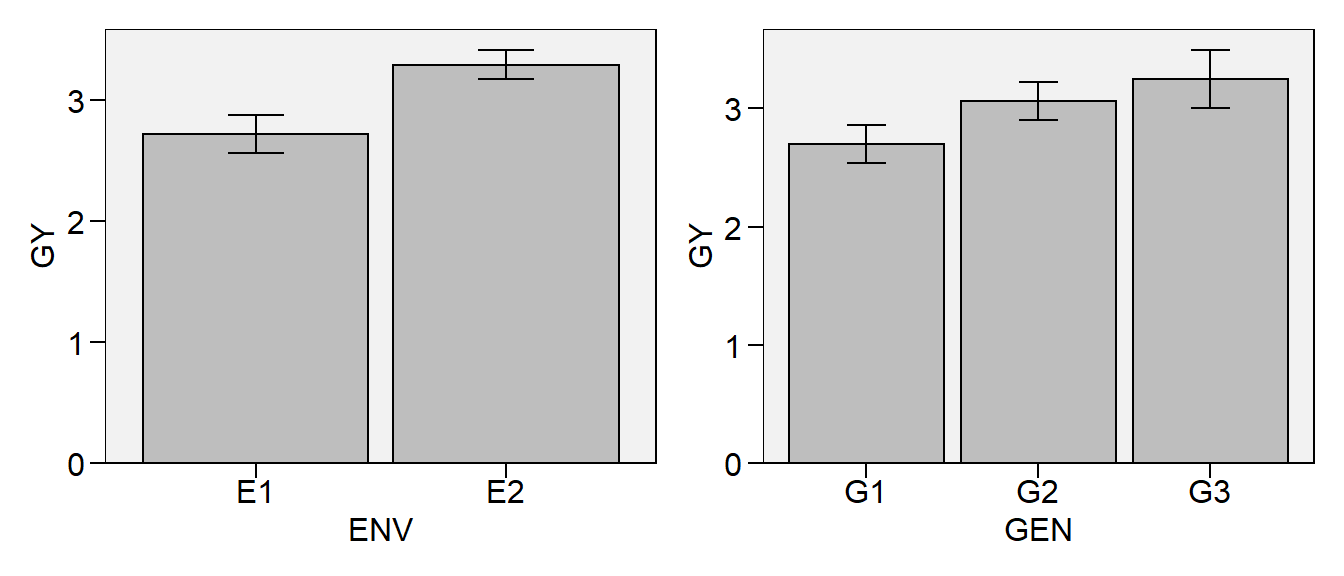
# One-way (environment mean)
env <- plot_bars(df, ENV, GY)
# One-way (genotype mean)
gen <- plot_bars(df, GEN, GY)
In this plot we will combine the two one-way graphs
# Combine the two plots
env + gen
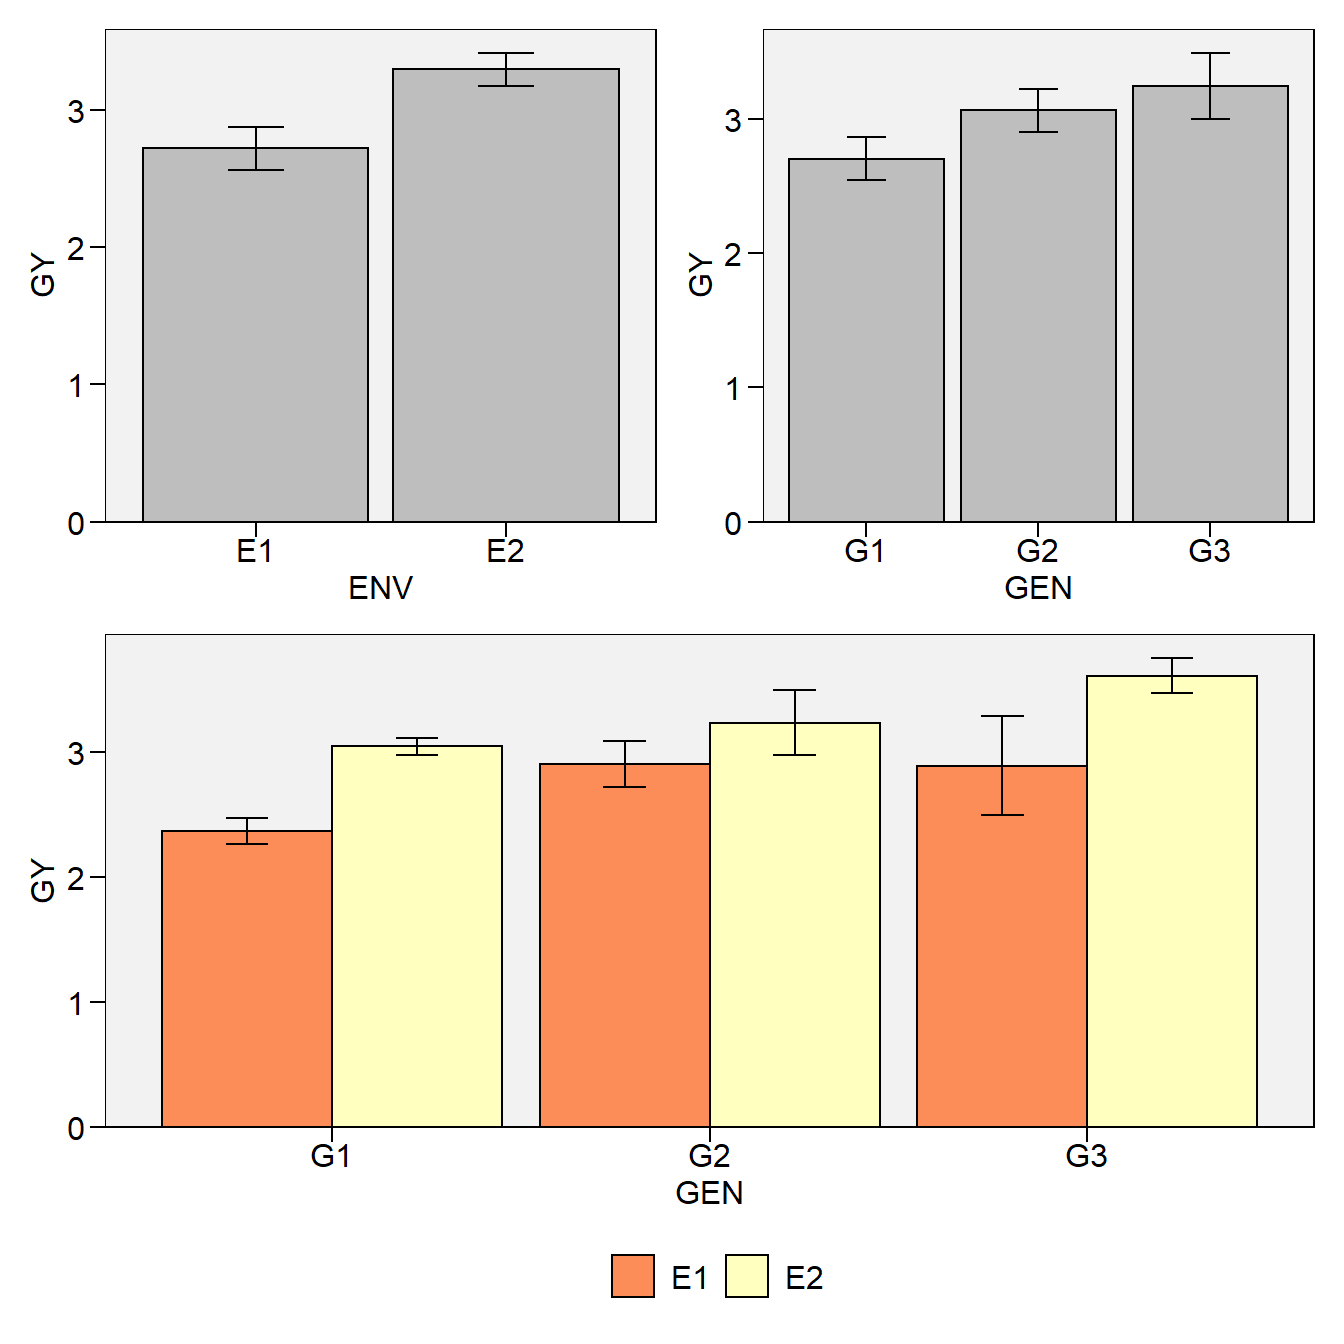
Now, lets create a two-way plot (genotype vs environment) with plot_factbars() and combine it with the previous plots.
# Two-way plot (genotype vs environment)
env_gen <- plot_factbars(df, GEN, ENV, resp = GY)

# Combine the one-way and two-way plots
p <- (env + gen) / env_gen
p
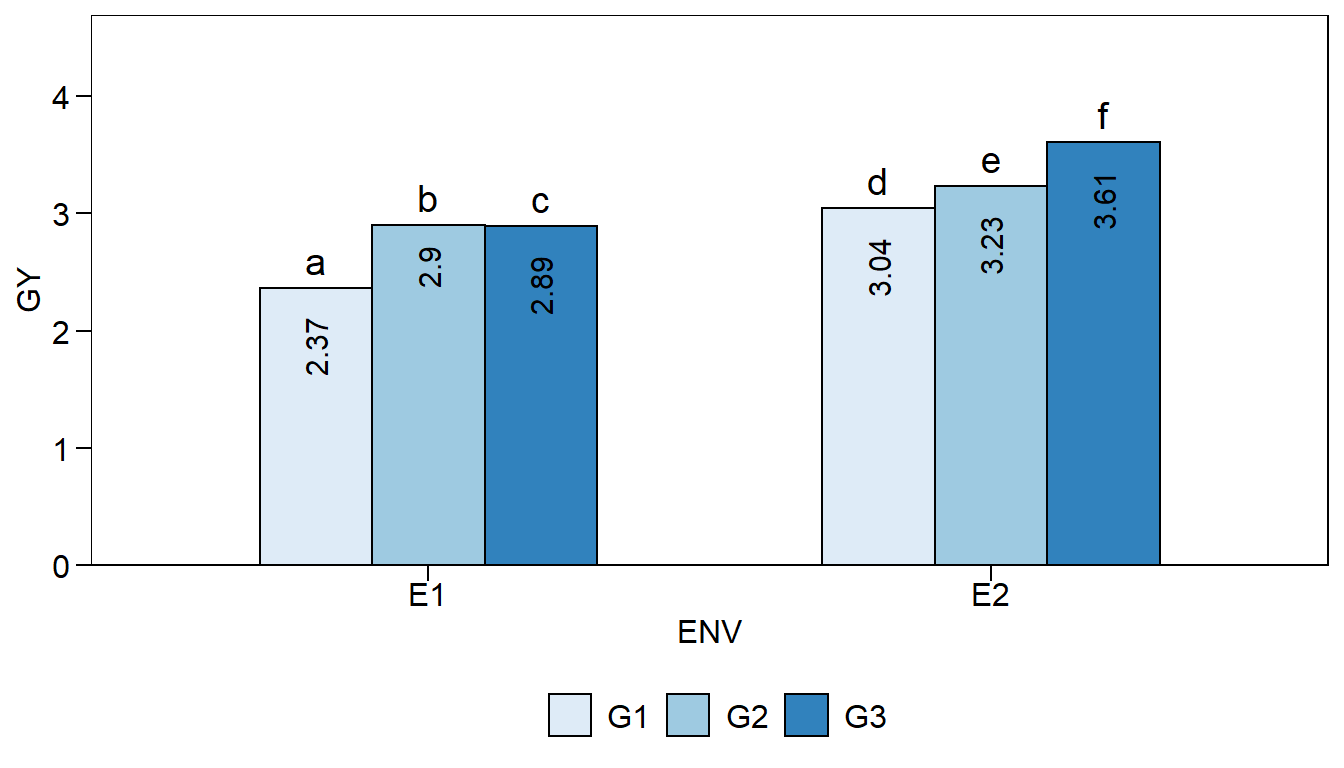
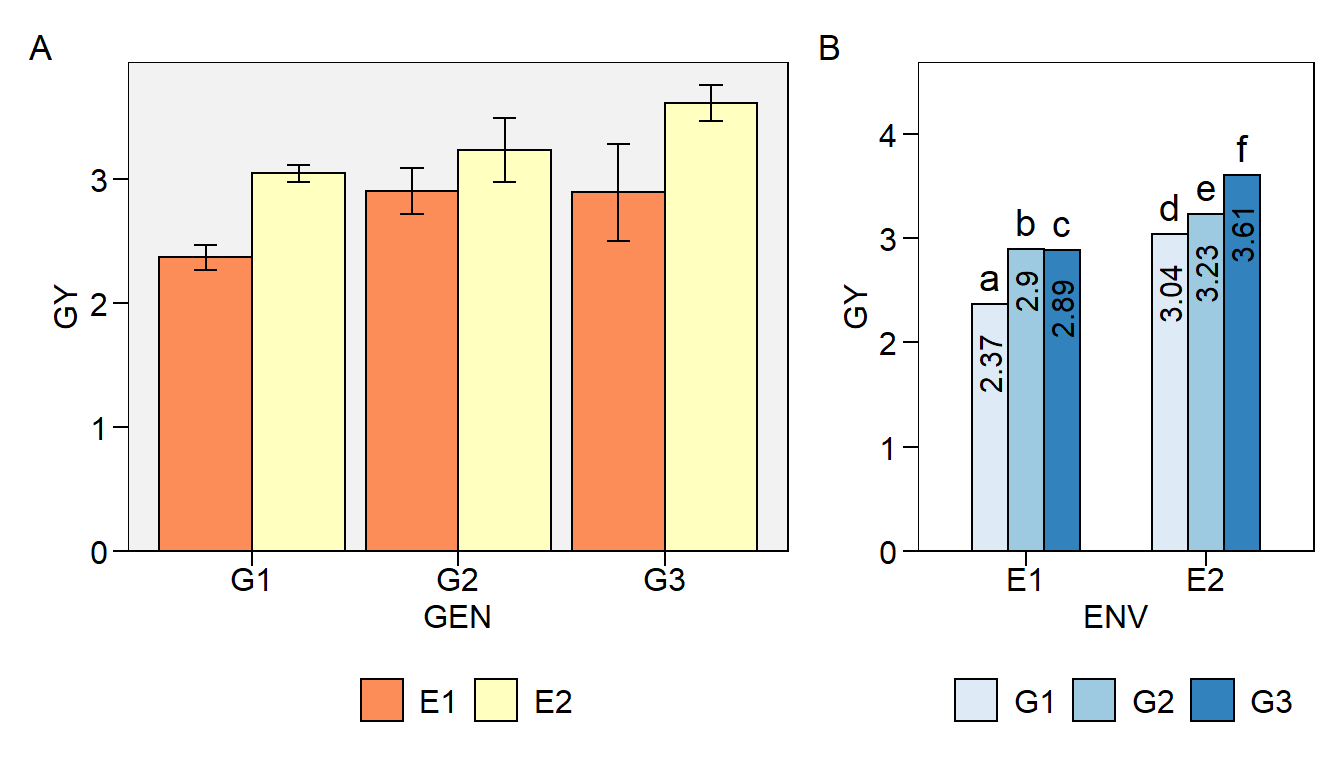
Let’s create a bit more elaborate two-way plot
env_gen2 <-
  plot_factbars(df,
                ENV,
                GEN,
                lab.bar = letters[1:6],
                resp = GY,
                y.expand = .3,
                errorbar = FALSE,
                width.bar = .6,
                palette = "Blues",
                values.vjust = 0.5,
                values.hjust = 1.5,
                values.angle = 90,
                plot_theme = theme_metan(color.background = transparent_color()),
                values = TRUE)
env_gen2
In this plot, we will combine the two two-way plots, giving a relative width greater to env_gen plot and adding capital letters as tag levels to the plots.
p2 <- arrange_ggplot(env_gen, env_gen2,
                     widths = c(1, .6),
                     tag_levels = "A")
p2
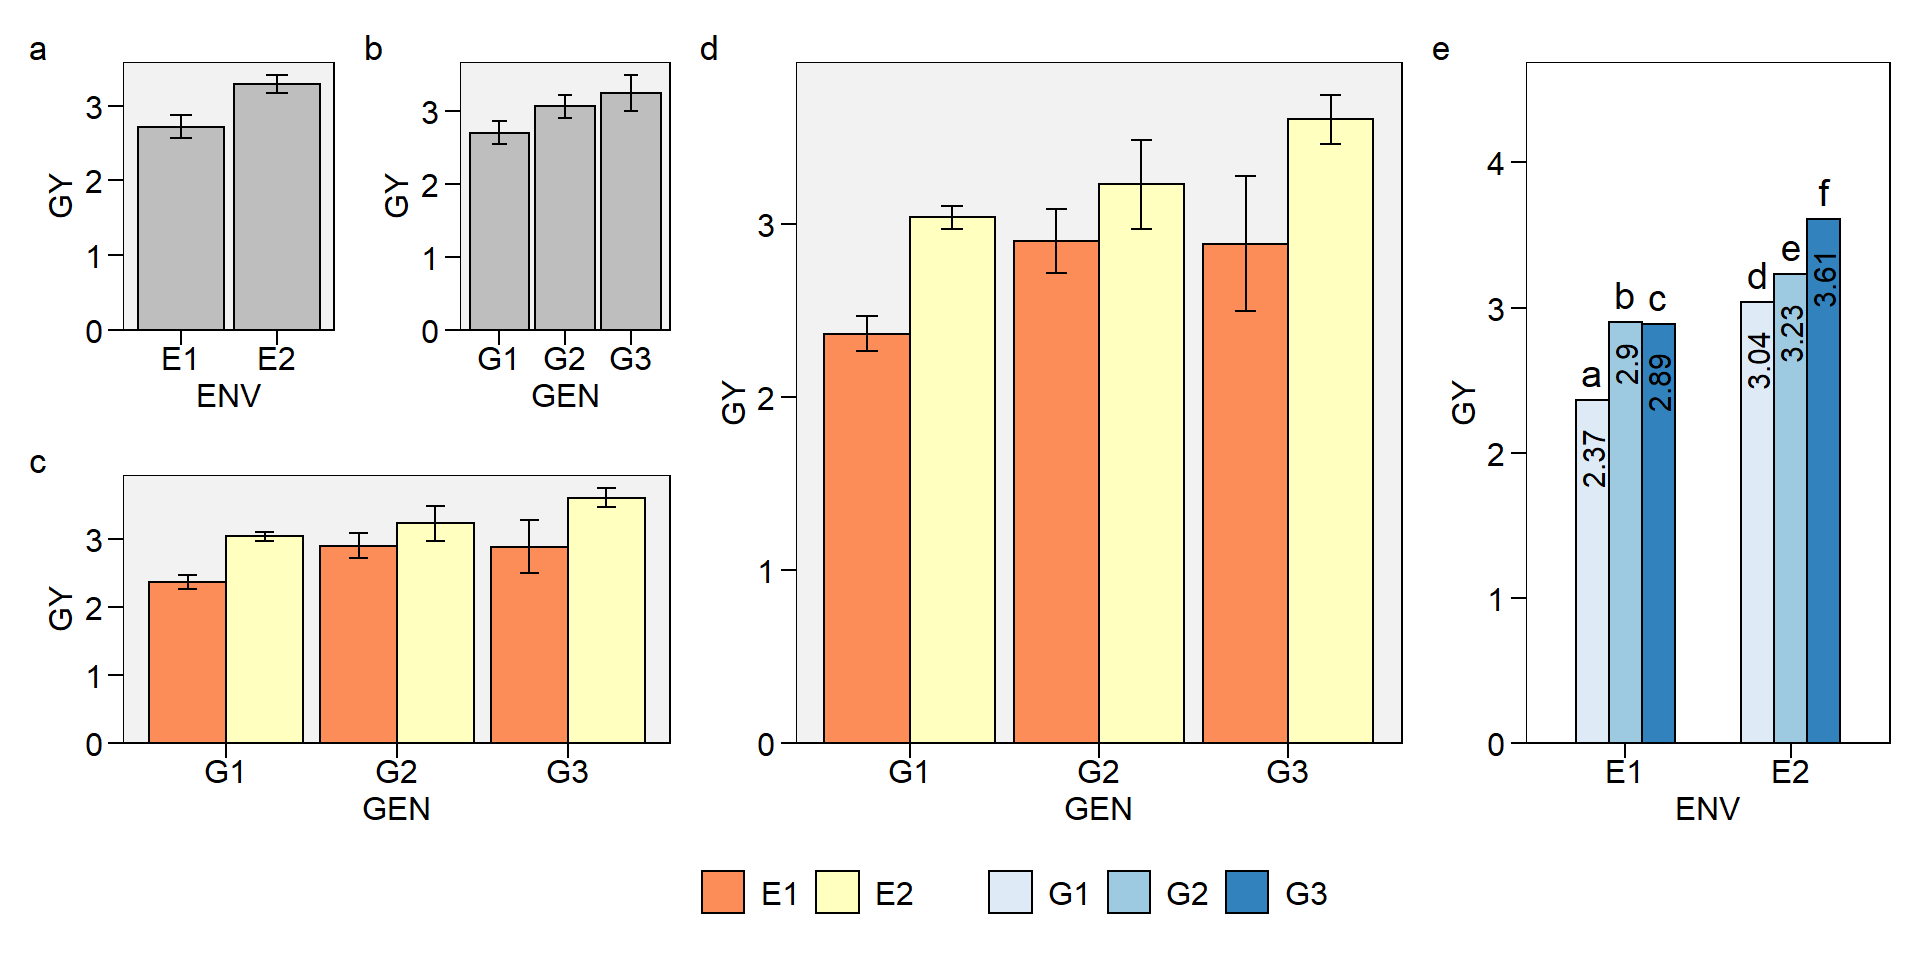
Now, let’s combine the two-way plots into the same graph
# Combine all plots into one graph
arrange_ggplot(p, p2,
               guides = "collect",
               widths = c(.5, 1),
               tag_levels = "a")