metan v1.6.1 on CRAN
I’m so excited to announce that the latest stable version (v1.6.1) of the R package metan is now on
CRAN. The main features included in this version are detailed below.
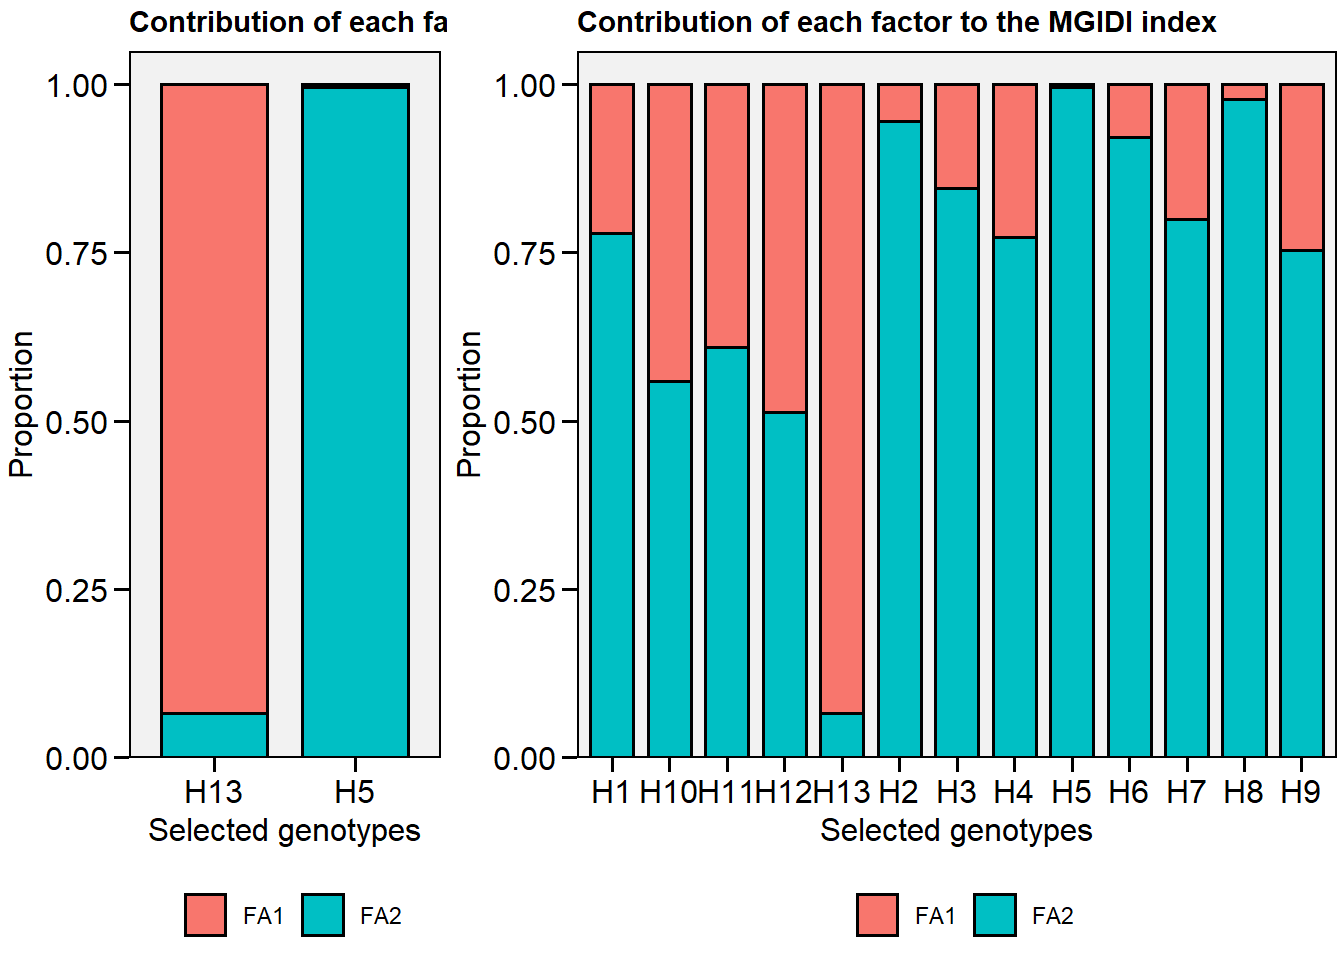
plot.mgidi()can now plot the contribution for all genotypes.
In metan v1.6.1, we can plot the contribution of the factors to the MGIDI index for all genotypes, including the arguments type = "contribution" and genotypes == "all"
library(metan)
# Registered S3 method overwritten by 'GGally':
#   method from
#   +.gg   ggplot2
# []=====================================================[]
# [] Multi-Environment Trial Analysis (metan) v1.6.1     []
# [] Author: Tiago Olivoto                               []
# [] Type citation('metan') to know how to cite metan    []
# [] Type vignette('metan_start') for a short tutorial   []
# [] Visit http://bit.ly/2TIq6JE for a complete tutorial []
# []=====================================================[]
model <- gamem(data_g,
               gen = GEN,
               rep = REP,
               resp = c(NR, KW, CW, CL, NKE, TKW, PERK, PH))
# Method: REML/BLUP
# Random effects: GEN
# Fixed effects: REP
# Denominador DF: Satterthwaite's method
# ---------------------------------------------------------------------------
# P-values for Likelihood Ratio Test of the analyzed traits
# ---------------------------------------------------------------------------
#     model     NR     KW       CW       CL     NKE     TKW     PERK    PH
#  Complete     NA     NA       NA       NA      NA      NA       NA    NA
#  Genotype 0.0056 0.0253 1.24e-05 2.25e-06 0.00952 0.00955 4.65e-07 0.051
# ---------------------------------------------------------------------------
# Variables with nonsignificant Genotype effect
# PH
# ---------------------------------------------------------------------------

# Selection for increase all variables
mgidi_model <- mgidi(model)
#
# -------------------------------------------------------------------------------
# Principal Component Analysis
# -------------------------------------------------------------------------------
# # A tibble: 8 x 4
#   PC    Eigenvalues `Variance (%)` `Cum. variance (%)`
#   <chr>       <dbl>          <dbl>               <dbl>
# 1 PC1      3.89            48.6                   48.6
# 2 PC2      3.09            38.6                   87.1
# 3 PC3      0.518            6.48                  93.6
# 4 PC4      0.272            3.40                  97.0
# 5 PC5      0.178            2.23                  99.2
# 6 PC6      0.0561           0.702                100.
# 7 PC7      0.00302          0.0377               100.
# 8 PC8      0.000966         0.0121               100
# -------------------------------------------------------------------------------
# Factor Analysis - factorial loadings after rotation-
# -------------------------------------------------------------------------------
# # A tibble: 8 x 5
#   VAR       FA1       FA2 Communality Uniquenesses
#   <chr>   <dbl>     <dbl>       <dbl>        <dbl>
# 1 NR    -0.0653 -0.899          0.813       0.187
# 2 KW    -0.444  -0.842          0.907       0.0930
# 3 CW    -0.935  -0.280          0.953       0.0468
# 4 CL    -0.952   0.0294         0.907       0.0926
# 5 NKE    0.405  -0.853          0.891       0.109
# 6 TKW   -0.913  -0.000960       0.834       0.166
# 7 PERK   0.933  -0.154          0.894       0.106
# 8 PH     0.0195 -0.879          0.772       0.228
# -------------------------------------------------------------------------------
# Comunalit Mean: 0.8713971
# -------------------------------------------------------------------------------
# Selection differential
# -------------------------------------------------------------------------------
# # A tibble: 8 x 10
#   VAR   Factor     Xo     Xs      SD  SDperc    h2      SG  SGperc sense
#   <chr> <chr>   <dbl>  <dbl>   <dbl>   <dbl> <dbl>   <dbl>   <dbl> <chr>
# 1 CW    FA 1    20.8   23.7   2.95   14.2    0.880  2.60   12.5    increase
# 2 CL    FA 1    28.4   28.7   0.300   1.06   0.901  0.270   0.950  increase
# 3 TKW   FA 1   318.   314.   -3.67   -1.16   0.712 -2.62   -0.824  increase
# 4 PERK  FA 1    87.6   87.6  -0.0589 -0.0672 0.916 -0.0539 -0.0615 increase
# 5 NR    FA 2    15.8   17.4   1.63   10.3    0.736  1.20    7.60   increase
# 6 KW    FA 2   147.   163.   16.2    11.0    0.659 10.7     7.27   increase
# 7 NKE   FA 2   468.   532.   64.0    13.7    0.713 45.6     9.74   increase
# 8 PH    FA 2     2.17   2.28  0.110   5.07   0.610  0.0670  3.09   increase
# ------------------------------------------------------------------------------
# Selected genotypes
# -------------------------------------------------------------------------------
# H13 H5
# -------------------------------------------------------------------------------

# plot the contribution of each factor on the MGIDI index
p1 <- plot(mgidi_model, type = "contribution")
p2 <- plot(mgidi_model, type = "contribution", genotypes = "all")
arrange_ggplot(p1, p2, rel_widths = c(1, 2))
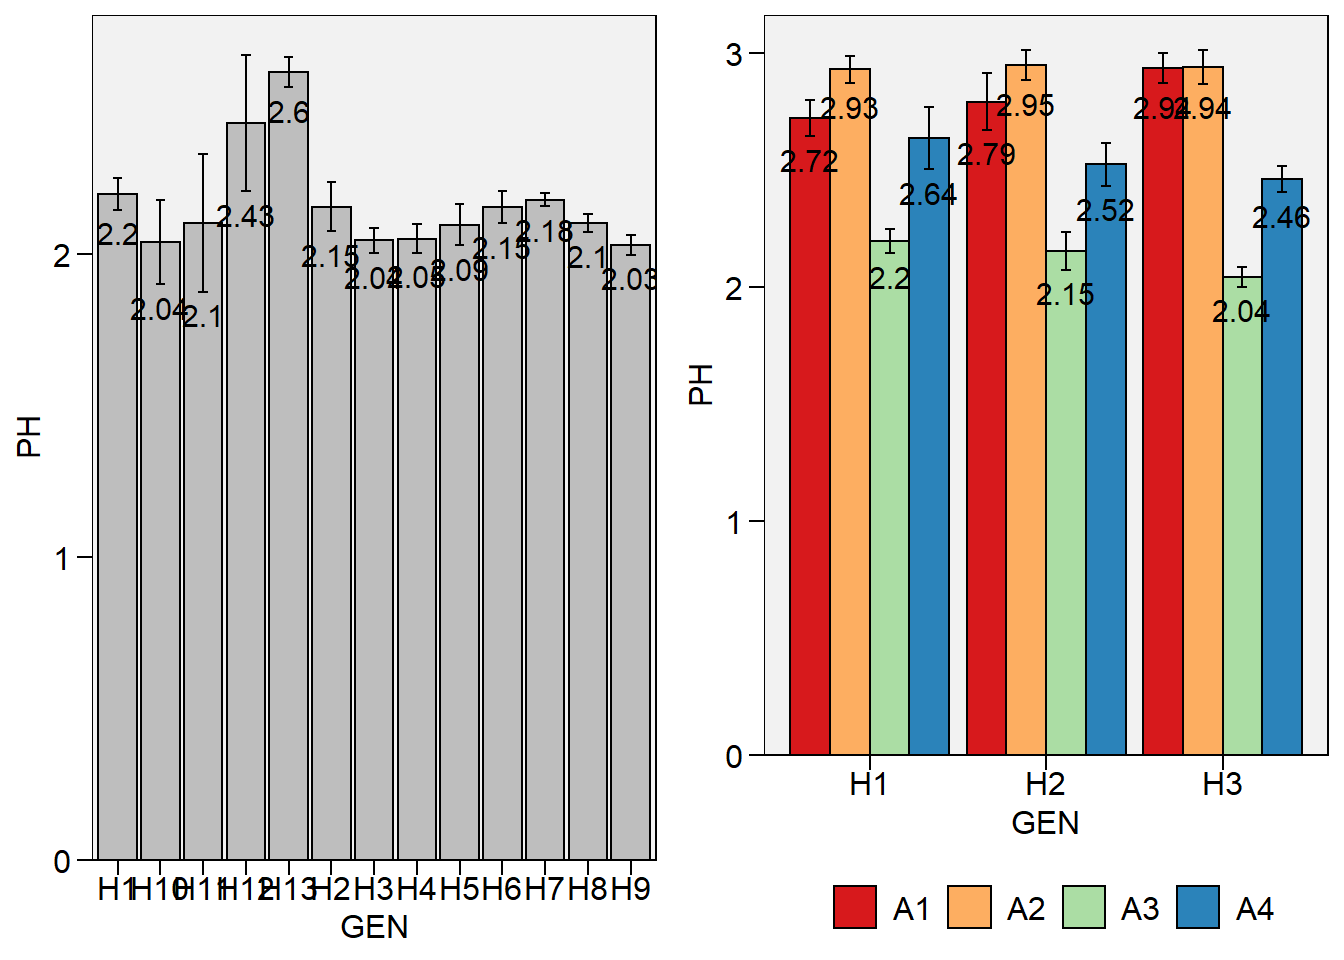
plot_bars()andplot_factbars()now shows the values withvalues = TRUE
# one categorical variable
p1 <- plot_bars(data_g, GEN, PH, values = TRUE)
p2 <-
data_ge2 %>%
  subset(GEN  %in% c("H1", "H2", "H3")) %>%
  plot_factbars(GEN, ENV, resp = PH, values = TRUE)
arrange_ggplot(p1, p2)
# Warning: Graphs cannot be horizontally aligned unless the axis parameter is set.
# Placing graphs unaligned.
- Update the functions by using the new
dplyr::across() - Update citation field by including number and version of the published paper.
citation("metan")
#
# Please, support this project by citing it in your publications!
#
#   Olivoto, T., and Lúcio, A.D. (2020). metan: an R package for
#   multi-environment trial analysis. Methods Ecol Evol. 11:783-789
#   doi:10.1111/2041-210X.13384
#
# A BibTeX entry for LaTeX users is
#
#   @Article{Olivoto2020,
#     author = {Tiago Olivoto and Alessandro Dal'Col L{'{u}}cio},
#     title = {metan: an R package for multi-environment trial analysis},
#     journal = {Methods in Ecology and Evolution},
#     volume = {11},
#     number = {6},
#     pages = {783-789},
#     year = {2020},
#     doi = {10.1111/2041-210X.13384},
#     url = {https://besjournals.onlinelibrary.wiley.com/doi/abs/10.1111/2041-210X.13384},
#     eprint = {https://besjournals.onlinelibrary.wiley.com/doi/pdf/10.1111/2041-210X.13384},
#   }
Follow metan on Github to find out the latest news!