Pacotes
library(tidyverse)  # manipulação de dados
library(metan)
library(rio)        # importação/exportação de dados

# gerar tabelas html
print_tbl <- function(table, digits = 3, n = NULL, ...){
  if(!missing(n)){
    knitr::kable(head(table, n = n), booktabs = TRUE, digits = digits, ...)
  } else{
  knitr::kable(table, booktabs = TRUE, digits = digits, ...)
  }
}
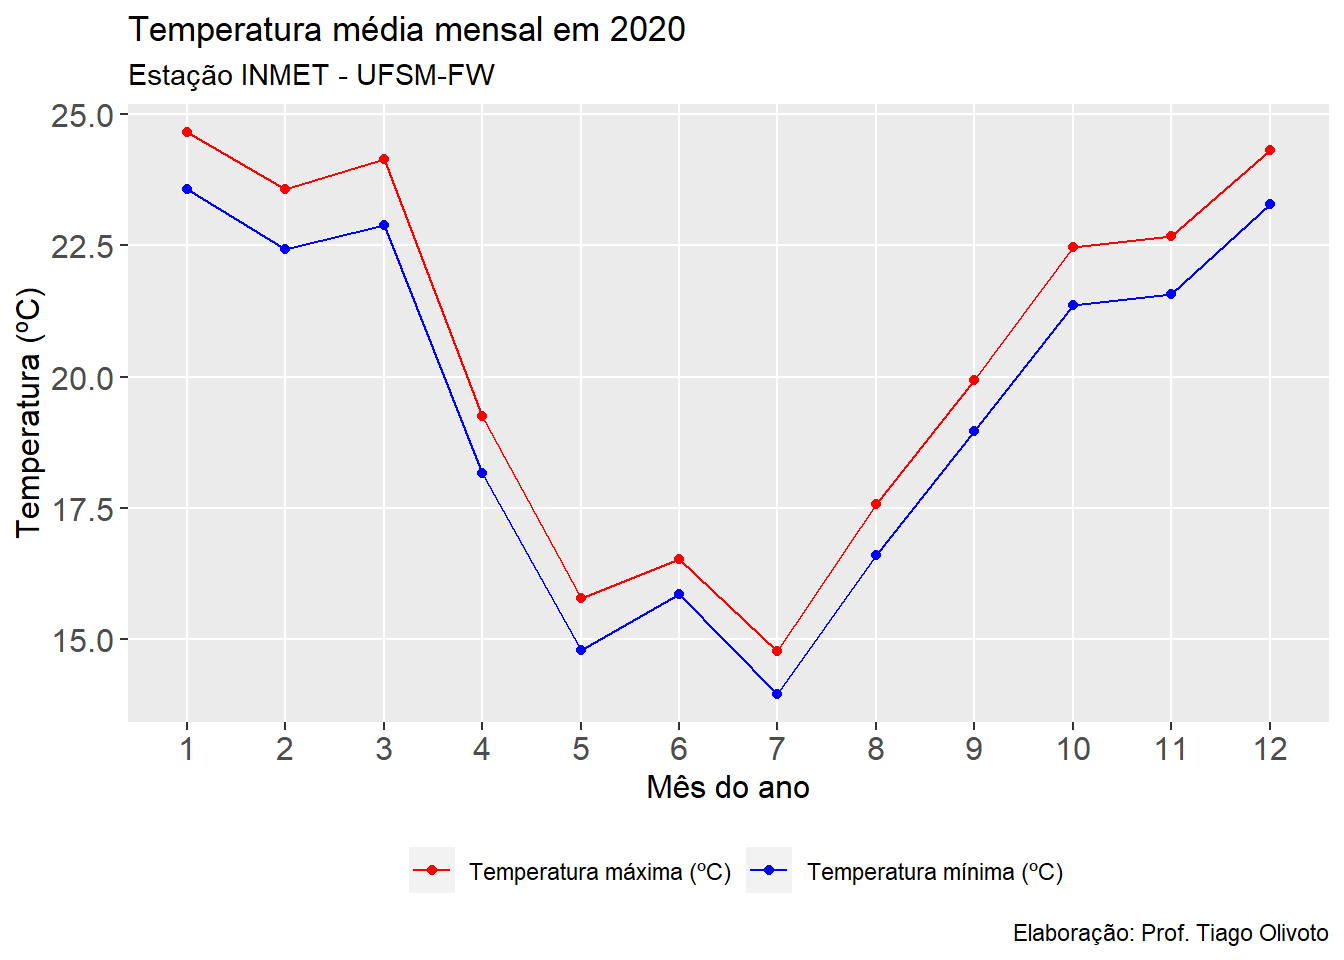
Temperaturas médias mensais
clima <- import("https://bit.ly/inmet_fred_2020")


clima_medias <-
clima %>%
  means_by(MES) %>%
  select(MES, TEMP_MAX, TEMP_MIN) %>%
  pivot_longer(-MES)

print_tbl(clima_medias, n = 20)
| MES |
name |
value |
| 1 |
TEMP_MAX |
24.652 |
| 1 |
TEMP_MIN |
23.570 |
| 2 |
TEMP_MAX |
23.566 |
| 2 |
TEMP_MIN |
22.430 |
| 3 |
TEMP_MAX |
24.154 |
| 3 |
TEMP_MIN |
22.897 |
| 4 |
TEMP_MAX |
19.245 |
| 4 |
TEMP_MIN |
18.177 |
| 5 |
TEMP_MAX |
15.781 |
| 5 |
TEMP_MIN |
14.804 |
| 6 |
TEMP_MAX |
16.535 |
| 6 |
TEMP_MIN |
15.862 |
| 7 |
TEMP_MAX |
14.779 |
| 7 |
TEMP_MIN |
13.957 |
| 8 |
TEMP_MAX |
17.579 |
| 8 |
TEMP_MIN |
16.603 |
| 9 |
TEMP_MAX |
19.930 |
| 9 |
TEMP_MIN |
18.962 |
| 10 |
TEMP_MAX |
22.469 |
| 10 |
TEMP_MIN |
21.358 |
# confeccionar gráfico
ggplot(clima_medias, aes(factor(MES), value, color = name, group = name )) +
  geom_point() +
  geom_line() +
  scale_color_manual(values = c("red", "blue"),
                       labels = c("Temperatura máxima (ºC)",
                                  "Temperatura mínima (ºC)"),
                       guide = "legend") +
  theme(panel.grid.minor = element_blank(),
        legend.position = "bottom",
        legend.title = element_blank(),
        axis.title = element_text(size = 12),
        axis.text = element_text(size = 12)) +
  labs(title = "Temperatura média mensal em 2020",
       subtitle = "Estação INMET - UFSM-FW",
       caption = "Elaboração: Prof. Tiago Olivoto",
       x = "Mês do ano",
       y = "Temperatura (ºC)")
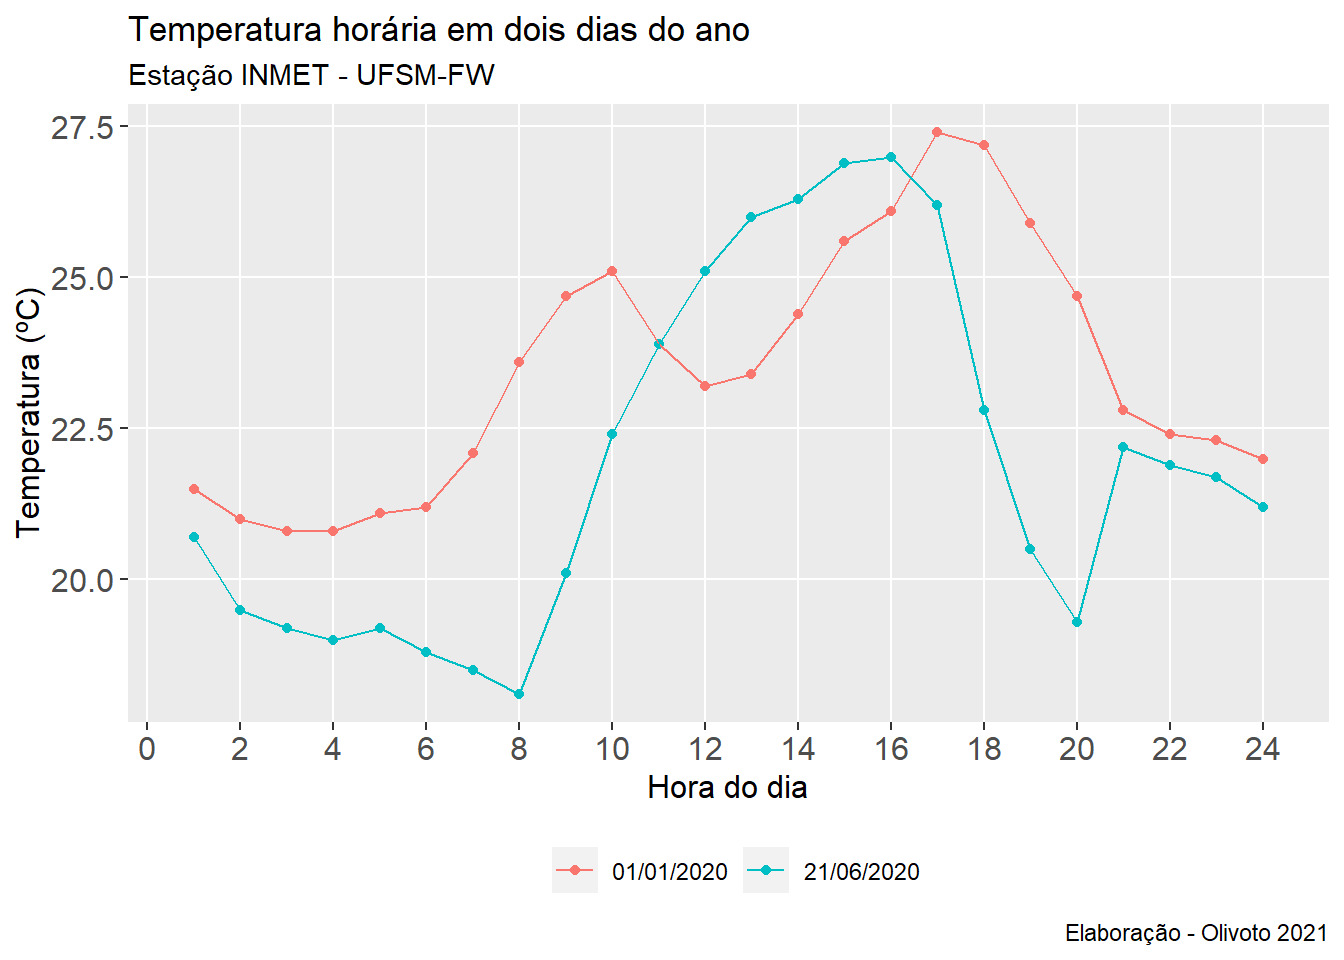
Temperaturas em dois dias
df_dias <-
  clima %>%
  select(DATA, HORA, TEMP_INST) %>%
  subset(DATA %in% c("01/01/2020", "21/06/2020"))


ggplot(df_dias, aes(HORA, TEMP_INST, color = factor(DATA), group = DATA)) +
  stat_summary(geom = "point",
               fun = mean) +
  stat_summary(geom = "line") +
  stat_summary(geom = "errorbar", width = 0.5) +
  theme(panel.grid.minor = element_blank(),
        legend.position = "bottom",
        legend.title = element_blank(),
        axis.title = element_text(size = 12),
        axis.text = element_text(size = 12)) +
  scale_x_continuous(breaks = seq(0,24, by = 2)) +
  labs(title = "Temperatura horária em dois dias do ano",
       subtitle = "Estação INMET - UFSM-FW",
       caption = "Elaboração - Olivoto 2021",
       x = "Hora do dia",
       y = "Temperatura (ºC)")
## No summary function supplied, defaulting to `mean_se()`
## No summary function supplied, defaulting to `mean_se()`
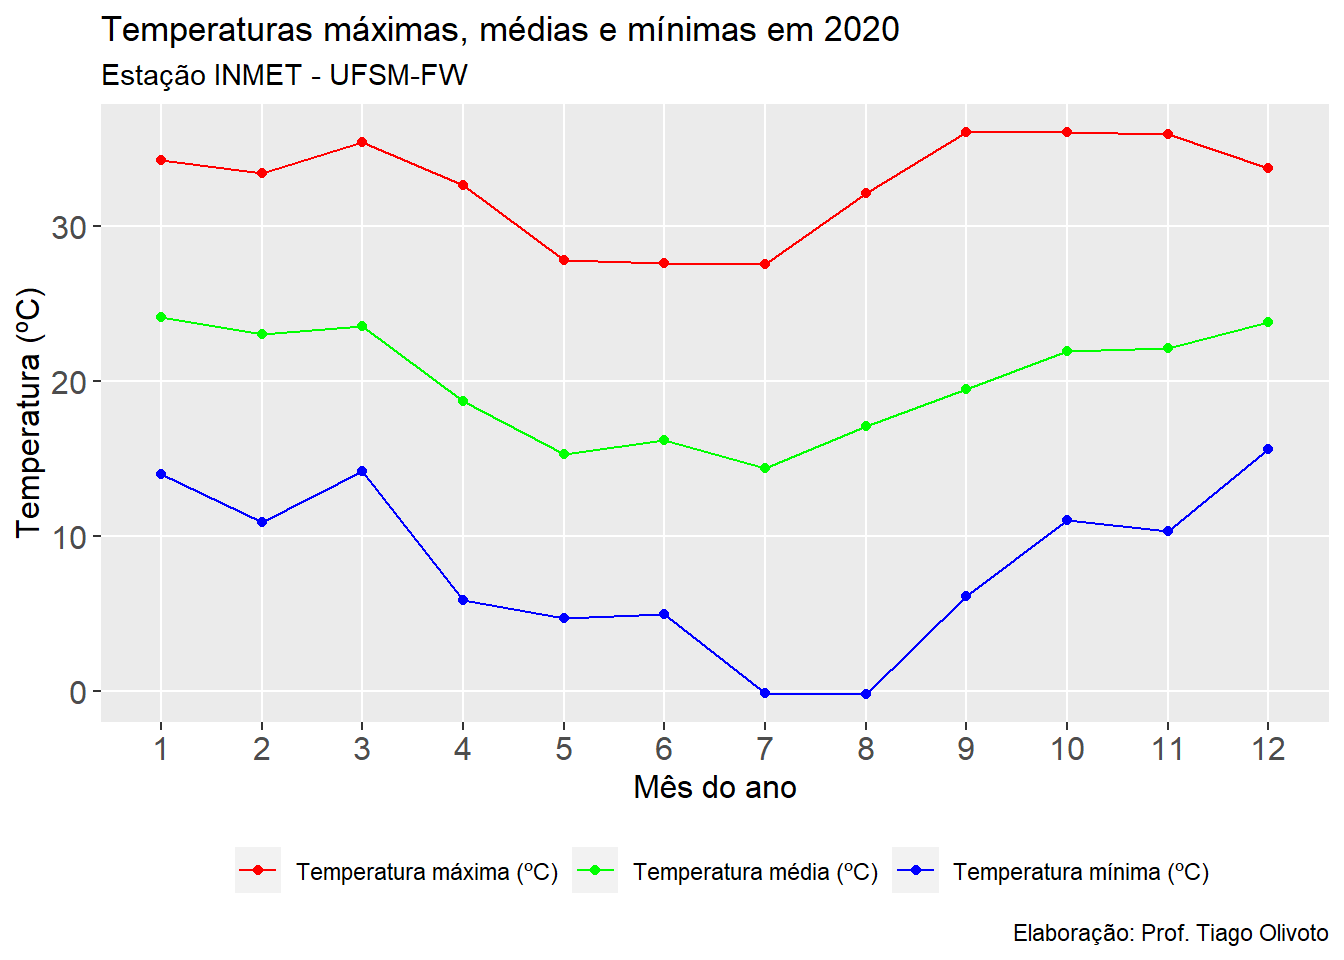
Temperaturas máximas e mínimas
clima_max_min <-
  clima %>%
  group_by(MES) %>%
  summarise(max = max(TEMP_MAX, na.rm = TRUE),
            min = min(TEMP_MIN, na.rm = TRUE),
            mean = mean(TEMP_INST, na.rm = TRUE)) %>%
  select(MES, max, min, mean) %>%
  pivot_longer(-MES)

print_tbl(clima_max_min, n = 20)
| MES |
name |
value |
| 1 |
max |
34.200 |
| 1 |
min |
14.000 |
| 1 |
mean |
24.085 |
| 2 |
max |
33.400 |
| 2 |
min |
10.900 |
| 2 |
mean |
22.992 |
| 3 |
max |
35.400 |
| 3 |
min |
14.200 |
| 3 |
mean |
23.523 |
| 4 |
max |
32.600 |
| 4 |
min |
5.900 |
| 4 |
mean |
18.705 |
| 5 |
max |
27.800 |
| 5 |
min |
4.700 |
| 5 |
mean |
15.289 |
| 6 |
max |
27.600 |
| 6 |
min |
5.000 |
| 6 |
mean |
16.199 |
| 7 |
max |
27.500 |
| 7 |
min |
-0.100 |
ggplot(clima_max_min, aes(factor(MES), value, color = name, group = name )) +
  geom_point() +
  geom_line() +
  scale_color_manual(values = c("red", "green", "blue"),
                     labels = c("Temperatura máxima (ºC)",
                                "Temperatura média (ºC)",
                                "Temperatura mínima (ºC)"),
                     guide = "legend") +
  theme(panel.grid.minor = element_blank(),
        legend.position = "bottom",
        legend.title = element_blank(),
        axis.title = element_text(size = 12),
        axis.text = element_text(size = 12)) +
  labs(title = "Temperaturas máximas, médias e mínimas em 2020",
       subtitle = "Estação INMET - UFSM-FW",
       caption = "Elaboração: Prof. Tiago Olivoto",
       x = "Mês do ano",
       y = "Temperatura (ºC)")