Inspeção de dados
Conjunto de dados
library(metan)
library(rio)

# gerar tabelas html
print_tbl <- function(table, digits = 3, ...){
  knitr::kable(table, booktabs = TRUE, digits = digits, ...)
}

# Dados "arrumados"
df_tidy <- import("http://bit.ly/df_tidy", setclass = "tbl")
Inspecionar dados
inspect(df_tidy)
## # A tibble: 13 x 9
##    Variable  Class     Missing Levels Valid_n    Min Median     Max Outlier
##    <chr>     <chr>     <chr>   <chr>    <int>  <dbl>  <dbl>   <dbl>   <dbl>
##  1 ENV       character No      0          114  NA     NA      NA         NA
##  2 GEN       character No      0          114  NA     NA      NA         NA
##  3 BLOCO     character No      0          114  NA     NA      NA         NA
##  4 ALT_PLANT numeric   No      -          114   0      2.52    3.04       1
##  5 ALT_ESP   numeric   No      -          114   0.75   1.34    1.88       0
##  6 COMPES    numeric   No      -          114  12.2   15.1    17.9        0
##  7 DIAMES    numeric   No      -          114  43.5   49.8    54.9        0
##  8 COMP_SAB  numeric   No      -          114  23.5   28.2    34.7        0
##  9 DIAM_SAB  numeric   No      -          114  13.3   16.0    18.3        0
## 10 MGE       numeric   No      -          114 106.   172.    251.         0
## 11 NFIL      numeric   No      -          114  12.4   16      21.2        1
## 12 MMG       character No      0          114  NA     NA      NA         NA
## 13 NGE       numeric   Yes     -          112 354    504.   5302          5
## Warning: Considering the levels of factors, .data should have 1 rows, but it has
## 114. Use 'as_factor()' for coercing a variable to a factor.
## Warning: Expected three or more factor variables. The data has only 0.
## Warning: Missing values in variable(s) NGE.
## Warning: Possible outliers in variable(s) ALT_PLANT, NFIL, NGE. Use
## 'find_outliers()' for more details.
## Warning: Zero values observed in variable(s) ALT_PLANT.


# converter as três primeiras colunas para fator
df_ok <-
  df_tidy %>%
  metan::as_factor(1:3)
Fragmentos de texto inesperados
# Encontrar fragmentos de texto
find_text_in_num(df_ok, MMG)
## [1] 112
df_ok[112, 12]
## # A tibble: 1 x 1
##   MMG
##   <chr>
## 1 335..2

# substitui '..' por '.' e converte para numérico
df_ok <-
  df_ok %>%
  replace_string(MMG, pattern = "\\.{2}", replacement = ".") %>%
  as_numeric(MMG)
Substituir zeros por NA
df_ok <-
  df_ok %>%
  replace_zero(ALT_PLANT)

# Nova inspeção
inspect(df_ok, plot = TRUE)
## # A tibble: 13 x 9
##    Variable  Class   Missing Levels Valid_n    Min Median     Max Outlier
##    <chr>     <chr>   <chr>   <chr>    <int>  <dbl>  <dbl>   <dbl>   <dbl>
##  1 ENV       factor  No      3          114  NA     NA      NA         NA
##  2 GEN       factor  No      13         114  NA     NA      NA         NA
##  3 BLOCO     factor  No      3          114  NA     NA      NA         NA
##  4 ALT_PLANT numeric Yes     -          113   1.71   2.52    3.04       0
##  5 ALT_ESP   numeric No      -          114   0.75   1.34    1.88       0
##  6 COMPES    numeric No      -          114  12.2   15.1    17.9        0
##  7 DIAMES    numeric No      -          114  43.5   49.8    54.9        0
##  8 COMP_SAB  numeric No      -          114  23.5   28.2    34.7        0
##  9 DIAM_SAB  numeric No      -          114  13.3   16.0    18.3        0
## 10 MGE       numeric No      -          114 106.   172.    251.         0
## 11 NFIL      numeric No      -          114  12.4   16      21.2        1
## 12 MMG       numeric No      -          114 227.   336.    452.         0
## 13 NGE       numeric Yes     -          112 354    504.   5302          5
## Warning: Considering the levels of factors, .data should have 117 rows, but it
## has 114. Use 'as_factor()' for coercing a variable to a factor.
## Warning: Missing values in variable(s) ALT_PLANT, NGE.
## Warning: Possible outliers in variable(s) NFIL, NGE. Use 'find_outliers()' for
## more details.

Outliers
# Outlier NFIL
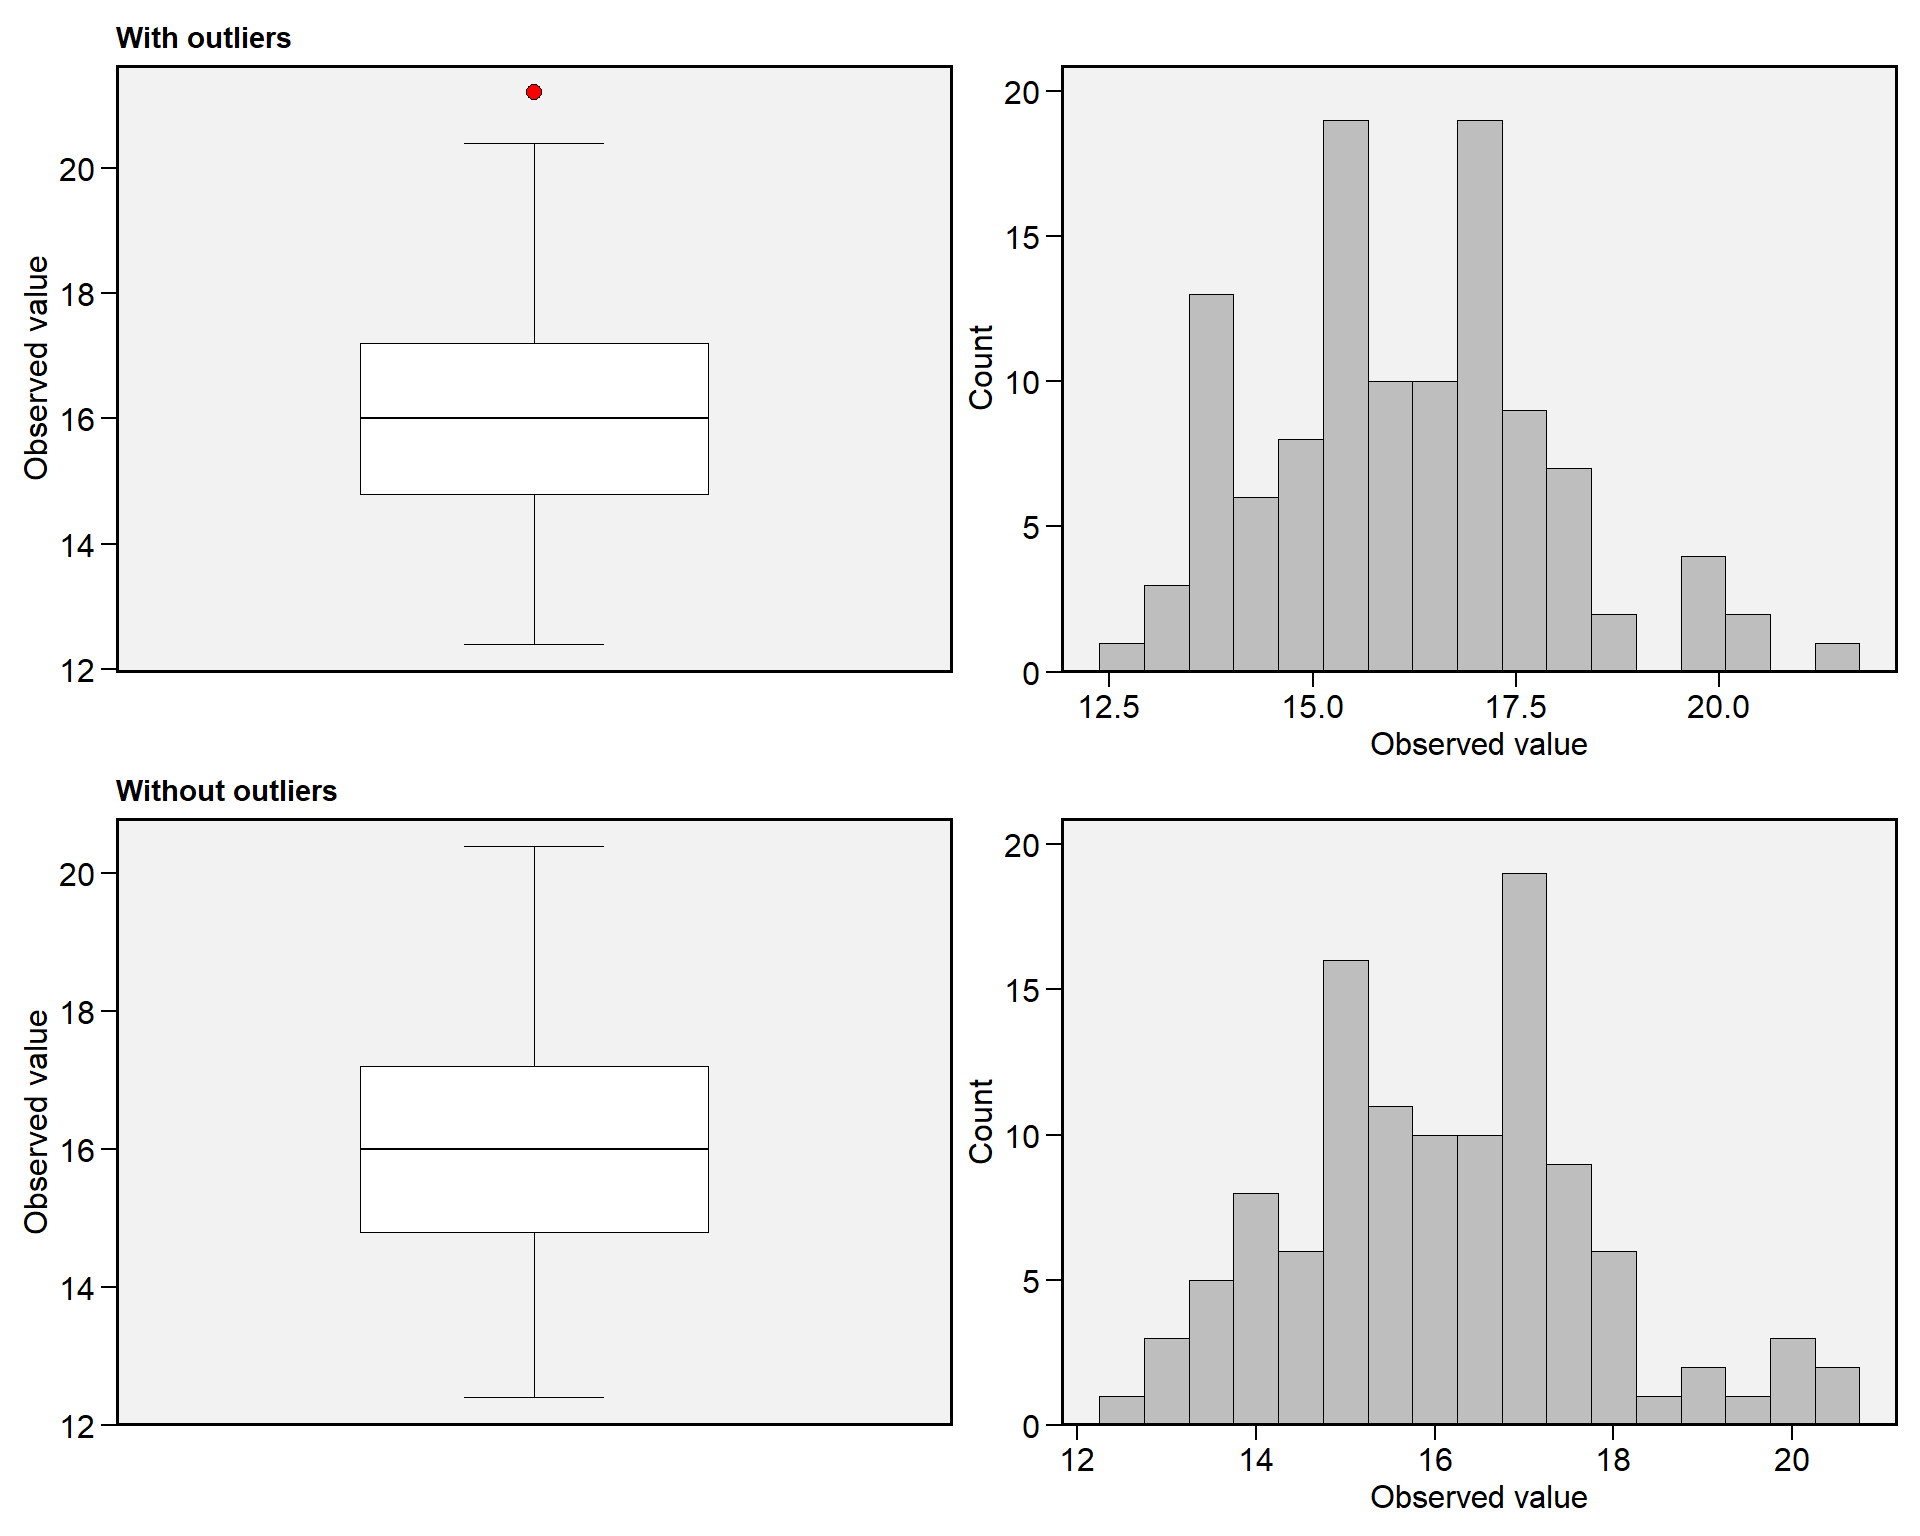
find_outliers(df_ok, NFIL, plots = TRUE)
## Trait: NFIL
## Number of possible outliers: 1
## Line(s): 14
## Proportion: 0.9%
## Mean of the outliers: 21.2
## Maximum of the outliers: 21.2 | Line 14
## Minimum of the outliers: 21.2 | Line 14
## With outliers: mean = 16.154 | CV = 10.833%
## Without outliers: mean = 16.11 | CV = 10.499%
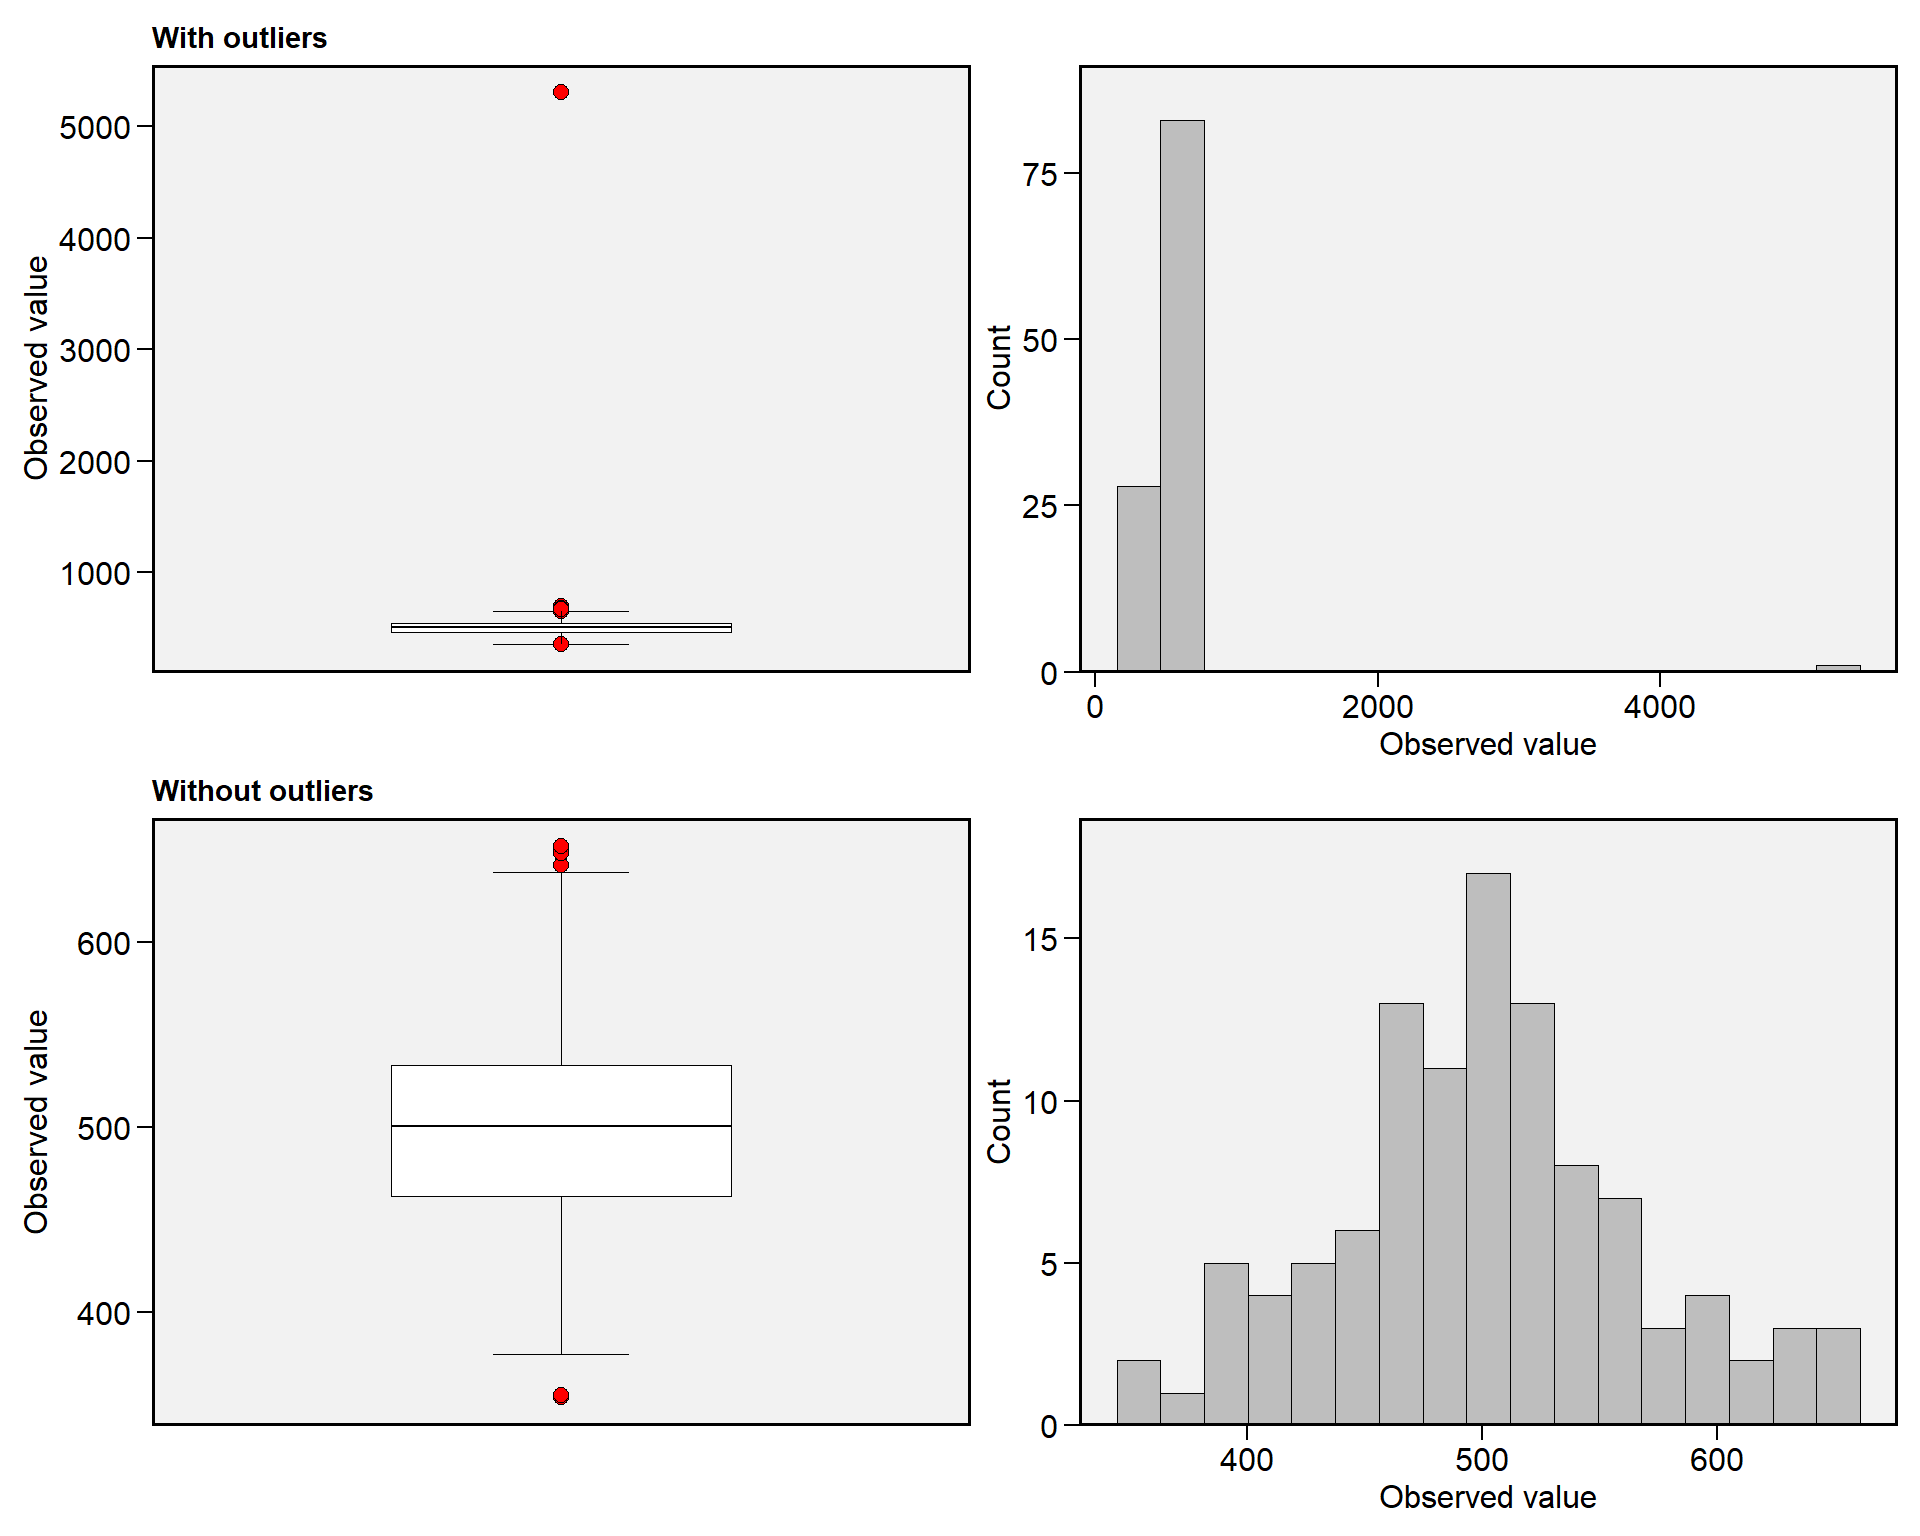
# Outlier NGE
find_outliers(df_ok, NGE, plots = TRUE)
## Trait: NGE
## Number of possible outliers: 5
## Line(s): 11 14 22 66 89
## Proportion: 4.7%
## Mean of the outliers: 1606.8
## Maximum of the outliers: 5302  | Line 22
## Minimum of the outliers: 667.8  | Line 89
## With outliers:    mean = 550.623 | CV = 83.324%
## Without outliers: mean = 501.269 | CV = 13.121%
# Corrigir valores
df_ok[22, 13] <- 530.2

# Exportar df_ok
# export(df_ok, "df_ok.xlsx")